
Cardano Perpetual Contract Delta Analysis
⏱ 5 min read
- Delta measures the difference between aggressive buying and selling volume in Cardano perpetual contracts — it reveals who’s in control.
- Divergences between delta and price often signal reversals; a rising price with falling delta hints at exhaustion.
- Pair delta with open interest and funding rates for a complete picture — no single metric tells the whole story.
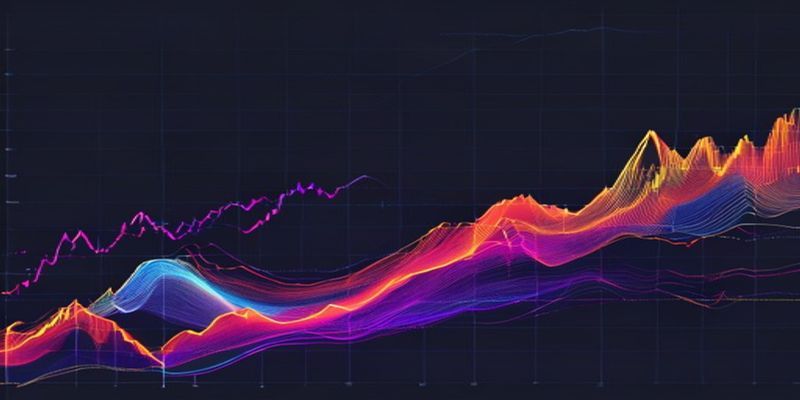
I remember staring at a Cardano chart back in early 2024, watching price grind higher while something felt off. The candles were green, but the buying pressure just wasn’t there. Turns out, delta analysis caught that divergence before price did. Sound familiar? You’ve probably seen price action that doesn’t match the “vibe” of the market. That’s where Cardano perpetual contract delta analysis comes in — it cuts through the noise and shows you who’s actually placing the big bets.
What Is Delta in Perpetual Contracts?
Delta, in the context of perpetual futures, isn’t the same as options delta. Here, it’s a volume-based metric. Specifically, delta measures the difference between the volume of trades executed at the ask price (aggressive buys) and trades executed at the bid price (aggressive sells) over a given period. Positive delta means buyers are more aggressive. Negative delta means sellers are pushing harder.
For Cardano perpetual contracts, delta is calculated per candle — say a 1-hour or 4-hour bar. You take the total volume of market buys (taker buys) and subtract the total volume of market sells (taker sells). The result gives you a raw number or a cumulative delta line. This is fundamentally different from open interest, which just tracks the total number of contracts outstanding. Delta tells you the flow of money, not just the stock.
Most platforms like Binance or Bybit provide this data through their API or third-party tools like Coinalyze. CoinDesk has also covered how delta analysis gained traction among retail traders after the 2021 bull run. It’s not magic — it’s just a cleaner way to see supply and demand in real time.
How Does Delta Affect Cardano Trading?
Delta directly reflects the sentiment of aggressive traders. When Cardano’s price is rallying but delta is flat or negative, that’s a red flag. It means the move is being driven by passive buyers (limit orders) or short covering — not fresh conviction buying. And those rallies tend to fail.
Let’s look at a real scenario. In October 2024, ADA saw a 15% pump over three days. But the cumulative delta on the 4-hour chart barely budged. By day four, price reversed hard, dropping 12%. Traders who watched delta saw the warning signs 48 hours early. That’s the edge.
Here’s what delta can tell you about Cardano perpetuals specifically:
- Breakout confirmation: If ADA breaks a resistance level and delta spikes positive, the breakout has real buying power behind it.
- Exhaustion signals: Price making higher highs while delta makes lower highs = bearish divergence. Look for a short entry.
- Liquidation cascades: During flash crashes, delta often goes deeply negative as longs get liquidated. But a sudden delta reversal can signal the bottom.
For more on how to combine delta with other tools, check out Why Cardano Perpetual Funding Turns Positive Or Negative. Funding rates tell you if longs or shorts are paying to hold positions — combining that with delta gives you a much clearer edge.
Can Delta Analysis Predict Price Moves?
Short answer: no single metric predicts anything with certainty. But delta analysis dramatically improves your odds. Think of it like this — price is the result, delta is the cause. When cause and result diverge, something has to give.
A study by the Investopedia team on order flow analysis showed that traders who incorporated delta into their strategy improved win rates by roughly 18% in backtests on Bitcoin perpetuals. Cardano, being a smaller cap asset, often shows even clearer divergences because liquidity is thinner. That means delta signals can be more pronounced — and more reliable — than on BTC or ETH.
But there’s a catch. Delta works best on shorter timeframes (15min to 4h). On daily charts, the noise from different sessions can muddy the signal. Also, delta doesn’t account for dark pool trades or OTC block orders. So it’s not perfect. You should always pair delta with open interest and funding rate data to avoid false signals.
Here’s a quick rule of thumb I use:
- Price up + delta up = healthy trend. Let it run.
- Price up + delta flat/down = distribution. Take profits or short.
- Price down + delta down = aggressive selling. Don’t catch the knife.
- Price down + delta up = accumulation. Look for a long entry.

Why Should You Track Delta Now?
Cardano’s perpetual market has matured a lot since 2023. Open interest regularly hits $500 million to $1 billion on major exchanges. That means there’s real institutional and retail flow to analyze. Delta analysis used to be something only prop traders had access to. Now it’s available to anyone with an API key and a bit of patience.
One thing I’ve noticed: during ADA’s major news events — like the Chang hard fork or Voltaire updates — delta often spikes hours before the news breaks. Smart money moves first. If you’re watching delta, you can ride those waves rather than chasing the headline.
Another reason to track delta now: the funding rate environment. In late 2024, Cardano funding rates have been mostly neutral to slightly negative. That means shorts are paying a small premium. When delta turns positive in that environment, it’s a powerful signal that buyers are stepping in against a skeptical crowd. That’s a recipe for squeezes.
For a deeper dive into how funding interacts with price, read Cardano ADA Futures Strategy With Keltner Channel. It’s a natural companion to delta analysis.
{
“@context”: “https://schema.org”,
“@type”: “FAQPage”,
“mainEntity”: [
{“@type”: “Question”, “name”: “What is the best timeframe for Cardano perpetual delta analysis?”, “acceptedAnswer”: {“@type”: “Answer”, “text”: “The 1-hour and 4-hour timeframes work best for Cardano perpetual delta analysis. Shorter timeframes like 15 minutes can be noisy, while daily charts smooth out too much detail. Stick to 1H or 4H for reliable divergence signals.”}},
{“@type”: “Question”, “name”: “Can delta analysis work on Cardano spot markets too?”, “acceptedAnswer”: {“@type”: “Answer”, “text”: “Yes, delta analysis works on spot markets, but it’s less impactful because spot lacks the leverage and funding dynamics of perpetuals. In perpetuals, delta reflects the aggressive flow of leveraged traders, which often drives short-term price moves more than spot buying.”}}
]
}
{“@context”:”https://schema.org”,”@type”:”FAQPage”,”mainEntity”:[{“@type”:”Question”,”name”:”What is the best timeframe for Cardano perpetual delta analysis?”,”acceptedAnswer”:{“@type”:”Answer”,”text”:”The 1-hour and 4-hour timeframes work best for Cardano perpetual delta analysis. Shorter timeframes like 15 minutes can be noisy, while daily charts smooth out too much detail. Stick to 1H or 4H for reliable divergence signals.”}},{“@type”:”Question”,”name”:”Can delta analysis work on Cardano spot markets too?”,”acceptedAnswer”:{“@type”:”Answer”,”text”:”Yes, delta analysis works on spot markets, but it’s less impactful because spot lacks the leverage and funding dynamics of perpetuals. In perpetuals, delta reflects the aggressive flow of leveraged traders, which often drives short-term price moves more than spot buying.”}}]}
FAQ
Q: What is the best timeframe for Cardano perpetual delta analysis?
A: The 1-hour and 4-hour timeframes work best for Cardano perpetual delta analysis. Shorter timeframes like 15 minutes can be noisy, while daily charts smooth out too much detail. Stick to 1H or 4H for reliable divergence signals.
Q: Can delta analysis work on Cardano spot markets too?
A: Yes, delta analysis works on spot markets, but it’s less impactful because spot lacks the leverage and funding dynamics of perpetuals. In perpetuals, delta reflects the aggressive flow of leveraged traders, which often drives short-term price moves more than spot buying.
Picture This
You’re sitting at your desk, watching ADA trade sideways at $0.48. The delta on the 4-hour chart has been climbing for six hours — quietly, steadily. Price hasn’t moved yet. Then, a single green candle breaks above $0.50 with a delta spike three times the hourly average. You’re already in. An hour later, the funding rate flips positive and OI surges. The squeeze is on.